![[IUCr Home Page]](iucrhom2.gif)
![[Commission Home Page]](cpd.gif)
|
|
The IUCr-CPD Homepage is at http://www.iucr.org/iucr-top/comm/cpd/
Xnd code: from X-ray laboratory data to incommensurately modulated phases. Rietveld modelling of complex materials.J.-F. Bérar (*) and G. Baldinozzi (+)(*) Laboratoire de Cristallographie, CNRS BP 166 F 38042 Grenoble Cedex, France. E-mail: berar@polycnrs-gre.fr (+) Laboratoire de Chimie Physique du Solide, CNRS ECP F 92995 Châtenay-Malabry Cedex, France. E-mail: baldinozzi@cps.ecp.fr
IntroductionThe Rietveld program xnd [1] was first written in the late 80's to take full profit of data collected with high resolution laboratory diffractometers. At that time, to reduce significantly the data collection time, only the significant regions of the pattern were recorded. Moreover, due to the goniometer encoding, scanning was not performed with fixed steps and/or fixed counting times. Xnd was therefore designed according to these requirements.A careful look to the data, often recorded with a simple filter or a graphite monochromator, showed that the radiation impinging on the sample was not perfectly monochromatised: small amounts of parasitic emission lines (and even W_LM lines related to the filament evaporation) can pollute the diffraction pattern. In order to analyse these data, xnd was not limited to the popular two wavelength choice. Moreover, real materials studied in chemistry laboratories, often present the coexistence of parasitic phases. Multiple phase handling was therefore introduced in the refinement code. These choices have led to a series of consequences for the line shape modelling. As a matter of fact, each wavelength and each phase have a priori specific profile functions: within the linear system approximation, these profiles can be described by the convolution of the functions related to the experimental geometry and to the intrinsic profile line shape [2]. Nevertheless, for this rigorous approach, time consuming calculations have to be performed. The Voigt (or its approximation by a pseudo- Voigt [3]) function turns out to be an efficient compromise between accurate line shape modelling and calculation time for most problems [4, 5, 6]. Within this approximation, the line shape parameters can be described in terms of simple Lorentzian and Gaussian contributions. Moreover, the meaning of these parameters can be straightforwardly related to a proper physical or instrumental origin [2]. Following the same leit motiv, preferred orientation effects were taken into account using a limited polynomial expansion on the spherical harmonic basis. These functions were also used to model the sample anisotropic broadening due to crystallite size or strain effects. Some other features were also added to the program: refinable background by linear interpolation coefficients or splines, rigid body constraints and restraints on bond lengths, absorption and anomalous scattering corrections, x-ray and neutron joint refinements [7]... In the following, two peculiar features of xnd are discussed in a more detailed way. Simultaneous refinement of multiple data setsThe increasing brightness of radiation sources has allowed the use of diffraction experiments to perform real time monitoring of phase transitions, chemical reactions and in situ studies of reaction kinetics. These experiments were generally analysed by refining independently a large number of data sets, the result of the refinement of a given data set being the starting point for the following one. This way of operating has two main counterbacks:
 This approach has some evident benefits as, for most of the parameters, a first order expansion (N=1) is often enough to describe the evolution. In that case the total number of refined parameters is divided by nearly 2/N_patterns . Therefore, small continuous variations of a parameter can be significantly analysed handling all the experiments simultaneously and more reliable esds for these parameters can be obtained even in the case of individual data sets having a rather poor statistical quality. To allow the use of these expansions, the data structure in xnd presents some peculiar features. All the refinable variables expected to present similar polynomial dependencies are grouped into blocks. In each block, at the beginning of it, a number precises the degree of the desired polynomial expansion. When no expansion is needed this number is 1, meaning that the parameters therein have the same value whatever the data set. For a linear expansion this number should be 2, 4 for a cubic expansion and so on. The following example is an excerpt of the lattice block for a tetragonal compound presenting a linear thermal expansion only 4 parameters are needed to fit all the data sets: 2
0 0 0 0
8.34245 11 1 0.00023 12 1
8.34245 11 1 0.00023 12 1
5.62745 1 0.00012 1
90.00 0 0 0
90.00 0 0 0
90.00 0 0 0
Another example, showing more kinds of
dependencies between variables often occurring in
chemistry is related to the site occupancy in
substitutional solid solutions and it requires complex
equations to be set up when more cations share the
same site [8].
Incommensurately modulated phasesMost of the structural studies of incommensurately modulated phases are developed using single crystal diffraction data. Nevertheless, many compounds are not easily synthesised as single crystals or the interesting phases present complex polydomain structures. Therefore, the study of the structure by single crystal techniques becomes very complex, or even not possible.The 4D formalism for mono-incommensurately modulated phases (superspace group symmetry, intensity and positioning of satellite reflections) has been implemented in xnd [9]. Another advantage is represented by the possibility to refine simultaneously x-ray and neutron diffraction data, taking advantage of the different atomic contrast and resolution available from these probes. Even in the early stages of the refinement, it is generally easier to decode the four dimensional Fourier maps obtained from x-ray diffraction as they are dominated by the heavier scatterers and there are less spurious maxima because of the atomic form factor shape. On the other hand, neutron Fourier maps give more details on the atomic positions and are very useful in the later stages of the refinements. This complementary use of the different probes is very powerful for the analysis of the structures of oxide compounds. In particular, the refinement of the incommensurately modulated perovskites-type structures is a challenging problem as (often) the onset of the modulated phase takes place at a ferroelastic phase transition. Moreover, light and heavy scatterers are generally present in these structures (ferroelectrics, superconductors ...). Therefore, the use of complementary sources of radiation is invaluable to give an accurate description of the oxygen frameworks. The following example is taken from the refinement of a superconducting oxide and shows the block of an atom presenting both displacive and substitutional modulation expanded to the second order Fourier term. Bi(3) BI 8 1 0.7527893 31 1.00 0.25 0 0.1137175 33 1.00 0.022780 32 -1.00 1.3653332 52 1.00 # Fourier 0.0133801 34 1.00 0 0 0 0 0.033348 36 1.00 -0.0095327 35 1.00 0 0 0.0032825 39 1.00 0 0 0 0 0 0 -0.0026739 37 1.00 0 0 0 0 -0.0019864 33 1.00 0 0 0.0298094 40 1.00The refinement of incommensurate phases can be considered a powerful tool for localising the structural disorder affecting a compound [10, 11]. Therefore, it is possible to get a better insight of complex and defective phases. This is particularly important since the small differences between the ideal and real structure of crystals is often responsible for the onset of interesting physical properties. This is for instance the case of oxygen stoichiometry in superconductors, of correlations between cation displacements in ferroelectrics, etc.
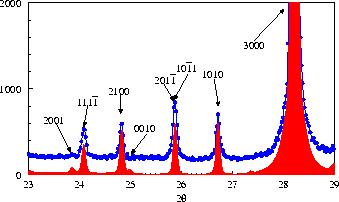 Figure 2: Example of refinement of the x-ray pattern of a modulated phase [10]. In incommensurate structure refinements it is necessary to distinguish the different satellite orders so different R_I (R_F) factors have to be defined for each set of reflections (Fig. 1). In general, satellite peaks have low peak to background ratios; therefore, the effect of the background noise on the estimated integrated intensity of the satellites is sensible and the R_I factor will be larger for these sets of reflections, even if the structural model is good. A second problem consists in the frequent overlapping of the satellite peaks with intense average structure main peaks; in this case, a small error on main peaks and on the description of their profile will strongly affect the estimation of the experimental intensities of the satellites. The importance of a very good equation between experimental and calculated line shapes is to be emphasised and, in this domain, xnd offers a large choice of functions and combinations of functions, with angle dependent parameters to optimise the simulation. Upcoming featuresThe latest release of xnd is 1.16. The refinement code is written in ANSI C language and it rans on various platforms (HP9000, SPARC, SGI, Linux, Power Mac). A compiled version for Microsoft platforms is also provided. The source code (compressed tar file) can be fetched on ftp://ftp.polycnrs-gre.fr/pub/xnd/. A very incomplete documentation always under heavy development can be found at http://www-cristallo.polycnrs-gre.fr/xnd/xnd.html or on the CCP14 mirror.The upcoming versions of xnd should include some new features:
References
Please feel free to email any queries to:
r.j.cernik@dl.ac.uk
|