![[IUCr Home Page]](iucrhom2.gif)
![[Commission Home Page]](cpd.gif)
|
|
The IUCr-CPD Homepage is at http://www.iucr.org/iucr-top/comm/cpd/
A Fundamental Parameters Convolution Based Approach to Synthesizing Line ProfilesAlan Coelho (*), Arnt Kern (*) and Bob Cheary (+)* Bruker Analytical X-Ray Systems GmbH, D- 76187 Karlsruhe, Germany + University of Technology, Sydney, Broadway, New South Wales, Australia 2007 E-mail: alan.coelho@ibm.net; Arnt.Kern@bruker-axs.de; cheary@phys.uts.edu.au; A flexible convolution based approach to synthesizing line profiles in X-ray powder data has been developed. Fundamental to this approach, "the Fundamental Parameters Approach" (FPA), is the fact that measurable geometric parameters are used to generate profile shapes. With FPA, Bragg angles are intrinsically corrected and profile shapes accurately described. This description of profile shapes has unmasked [2, 3] small levels of broadening in the Standards Refernce Materials of LaB6 (SRM 660), Cr2O3 (SRM 674a) and CeO2 (SRM 674a). X-ray lines cannot be fitted with a simple function as their shape changes significantly over the 2q range. At low angles instrumental effects such as the finite width and finite length of the receiving slit control the width of the line profile and there is appreciable asymmetry. At high angles spectral dispersion takes over and the line shape is controlled by the emission spectrum of the target. Analyses of X-ray line profiles from reference materials using the pseudo-Voigt function [8, 7, 4] found that the shape tends towards Gaussian at low angles and Lorentzian at high angles. Pseudo-Voigts fit well at high angles but the fit gets progressively worse at low 2q angles and systematic errors develop in the integrated intensities when fitting strongly overlapped lines without an asymmetry correction. Of all the single function profile models currently in use (reviewed in [6]) none of them gives an accurate description over the whole 2q range.
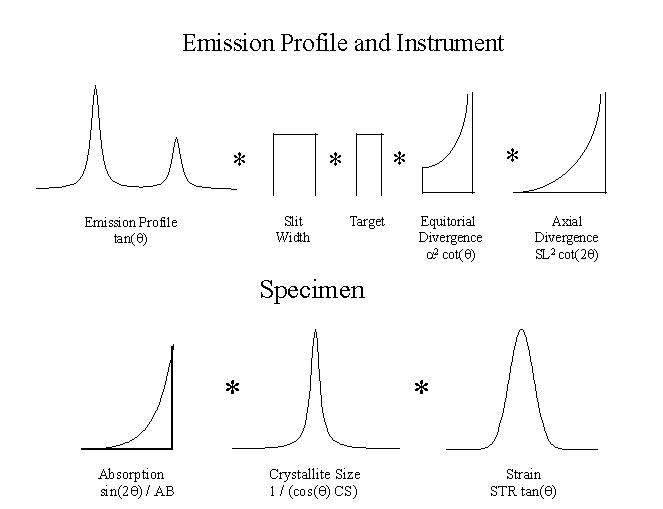 Fig. 1: Representation of the most important instrument and sample related effects contributing to observed line profile shapes. On the other hand FPA accurately models line profile over the full 2q range for a wide range of instrumental configurations [1]. The line profiles are synthesized in terms of the emission profile, the dimensions of the diffractometer and the specimen parameters (Fig. 1). The specimen related effects, such as specimen transparency, crystallite size and strain broadening, are entered as refinable values. The physical parameters of the diffractometer, such as the receiving slit length, horizontal divergence, and the primary and secondary Soller slit angles, are measurable quantities that can be refined. This is necessary as in practice one would not expect to obtain refined values matching the actual diffractometer values exactly; there are too many second order effects in diffractometer profiles and some instrumental effects cannot be described accurately enough to make this feasible. It would not be unrealistic however, to expect refined values within ±10% of the instrumental values [3]. Conversely, if physically unrealistic values are needed to describe a profile, there is clearly a major deficiency in the model used to describe the diffractometer. Specimens of small linear attenuation coefficients produces appreciable broadening and peak displacement and therefore this parameter should be refined.
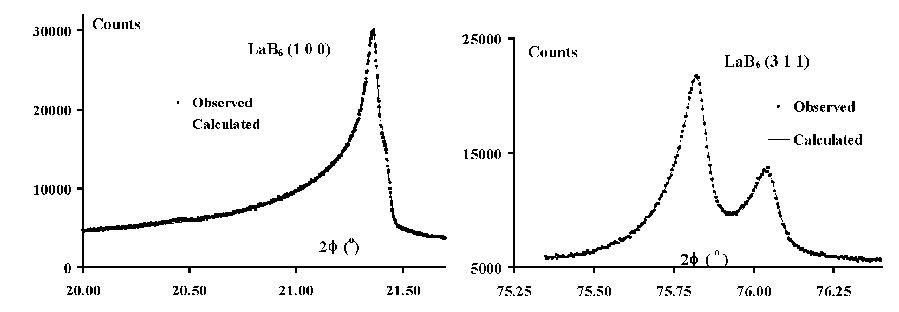 Fig. 2: Examples of observed and fitted LaB6 (SRM 660) profiles for an instrument with no Soller slits. In this case all the profiles are strongly asymmetric, but are readily accommodated by the applied model accounting for axial divergence. Note the different 2q axes.
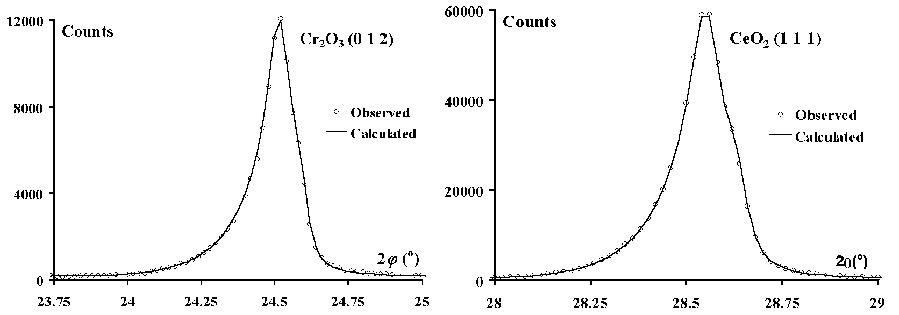 Fig. 3: Examples of observed and fitted profiles for the low angle lines of CeO2 (SRM 674a) and Cr2O3 (SRM 674a). 5,1° Soller slits in the incident beam, no Soller slits in the diffracted beam. The benefits that follow from being able to synthesize and fit X-ray line profiles accurately in terms of fundamental parameters are manifold and clearly show up from the excellent description of observed line profiles (Figs. 2 and 3). It will be possible to identify whether or not a diffractometer is operating at its optimum resolution and determine unequivocally whether or not an observed profile possesses specimen broadening. Synthesized profiles rather than profiles from reference materials can then be used as the basis for deconvoluting instrumental effects from observed profiles. This should allow crystallite size analysis and strain analysis to be carried out at much lower levels of X- ray line broadening, possibly up to apparent crystallite sizes *1µm. We have found that good reference powder standards for line profile analysis are not readily available. Many materials such as powder standards give some degree of specimen broadening [5]. Computationally demanding numerical convolutions, indicative of the fundamental parameters approach, have in the past made it an unlikely approach for routine analysis but this has been overcome with the inclusion of a number of fast algorithms and by using a direct convolution-interpolation procedure. Efficiencies in the refinement procedure together with extremely fast algorithms has resulted in an approach that is at least three to ten times faster than conventional profile fit programs - even for non- convolution based fit routines. References
Please feel free to email any queries to:
r.j.cernik@dl.ac.uk
|
