![[IUCr Home Page]](iucrhom2.gif)
![[Commission Home Page]](cpd.gif)
|
|
The IUCr-CPD Homepage is at http://www.iucr.org/iucr-top/comm/cpd/
Practical experience of BEARTEX, the Berkeley texture packageDaniel ChateignerLab. Physique de l'Etat Condensé, 72085 Univ. du Maine - Le Mans, France. E-mail: Daniel.chateigner@univ-lemans.fr; WWW: WWW: http://www.univ-lemans.fr/~dchat/danielc/daniel.htm
AbstractThe Berkeley Texture Package (Beartex) is demonstrated for its most usual applications in the field of texture analysis. It is shown how a regular texture analysis can be routinely conducted with this package, in the case of neutron or X-ray data, using several examples concerning different materials and elaboration processes, on thin films and bulks. It is then demonstrated on several examples how texture can correlate physical properties quantitatively, and how it helps understanding anisotropic measurements.1. IntroductionQuantitative texture analysis (QTA) has now been developed for some 50 years. From the early works thoroughly documented in many books [Bunge, 1982 and 1982a; Wenk, 1985; Matthies et al., 1987], to the up to date methodologies for the data treatments and using new generation tools, a tremendous amount of work as been achieved.Used in the former time by geologists, then metallurgists, QTA became essential in a lot of different fields in science, with the parallel development of more and more anisotropic materials, due to its capability to describe the correlation between physical properties and crystallites orientations. However, as materials are obtained by sophisticated processes (natural or not) giving rise to multiple phases of different crystalline symmetry with various texture strengths, crystalline ratios, particle sizes and strain states, QTA is becoming a complex characterisation procedure. Among all possibilities to calculate the main texture quantities, we choose for this paper to illustrate a routine texture analysis using the Berkeley Texture Package (Beartex, Wenk et al., 1998), taking several examples of materials, and in order to give people a rough approach of what QTA means. People more interested than what is presented here are invited to consult other formalisms, methodologies and packages. After a first general definition of QTA, we will show how to conduct a usual X-ray QTA, on HgI2 thin films, in order to get familiar with the terms that are used. This study will also demonstrate the capability of texture analysis to describe hetero-epitaxial relationships. We will then show how neutron diffraction using position sensitive detector allow QTA on multiphase samples, even with strong texture strength differences and with low symmetries. In the last part we will show how QTA can correlate and help understanding anisotropic physical properties. For this we chose three examples of materials science, anionic conductors (BiCoVOx), high performance permanent magnets (Sm-Co family) and high temperature superconductors (YBCO and BSCCO family). A general definition of QTA would be out of concerns in this paper and is enough detailed using examples in the paper by Wenk et al (1998). The reader interested in getting familiar with the terms that are used here find examples at http://www.univ- lemans.fr/~dchat/beartex/beartex.htm. The study presented on this site demonstrates the capability of texture analysis to describe hetero-epitaxial relationships [Chateigner et Erler, 1997] using classical X-rays. Peoples using neutron diffraction (and position sensitive detector) and interested in QTA on multiphase samples with low crystal symmetries may find it in the paper of Chateigner & al., 1997]. We prefer for this example paper to focuss on the correlations between QTA and anisotropic physical properties. For this we chose three examples of materials science, anionic conductors (BiCoVOx), high performance permanent magnets (Sm-Co family) and high temperature superconductors (YBCO and BSCCO family)." 2. Correlation of QTA with physical properties2.1. Anionic conductivity in BiCoVOx ceramics [Muller et al., 1996]Solid electrolytes exhibiting good ionic conductivity by O2- ions are used in oxygen sensors, oxygen pumps, or fuel cells. Their main features are (i) a high oxide ion conductivity over a wide range of temperatures and oxygen partial pressures, and (ii) a low fabrication cost of tubes and membranes with large surface and low thickness. Therefore, the polycrystalline ceramics represent an important economical and technological challenge.Among compounds showing such properties, the compound discovered in 1985 [1,2] and formulated Bi4V2O11 is of interest. Its structure is close to the Aurivillius phase Bi2MoO6. This compound may be viewed as an intergrowth, along the c axis, of alternating (Bi2O2)2+ sheets and (MoO4)2- perovskite layers. The complete substitution of Mo6+ ions by V5+ cations induces the creation of oxygen vacancies to conserve the total electroneutrality. In previous works [3,4], it has been demonstrated that these vacancies are located in the plane of octahedra (VO5.5r0.5), conferring a two-dimensional behaviour of the conductivity. The aim of this work was to show the relation between the texture and the conductivity of the Bi4(V0.85Co0.15)2O11-d compound. The uniaxial pressure-induced and the magnetic field-induced orientations were studied. To create orientations in the polycrystalline samples, two processes based on the application of a uniaxial pressure (about 2 kbar) and/or a magnetic field (7T) were used on powders. Then we measured the {006} pole figures and normalised them by direct integration in order to check c axis orientations strengths. The ionic conductivity measurements were carried out by impedance spectroscopy on single crystals and on oriented polycrystalline ceramics. The texture of one plate-shaped single crystal was firstly investigated. In single crystals, the orientation density reaches high values somehow limited by the experimental resolution. For example, a maximal density near 4000 m.r.d. was estimated using the {006} pole figure. The (006) distribution density measured on the 2 kbar uniaxially pressed sample (P2), has shown a low orientation with a maximal density equal to 14.8 m.r.d.. Using a pressure of 12.5 kbar, the resulting {006} pole density was slightly larger, with 22 m.r.d.. When a magnetic field of 7 T was combined with the 2 kbar pressure (H7P2), the maximum {006} pole density reached 33 m.r.d.. Following these results, both pressure and magnetic field align the grains with their c axes parallel to the applied force or magnetic field direction, the strongest orientation being obtained with a combined process.
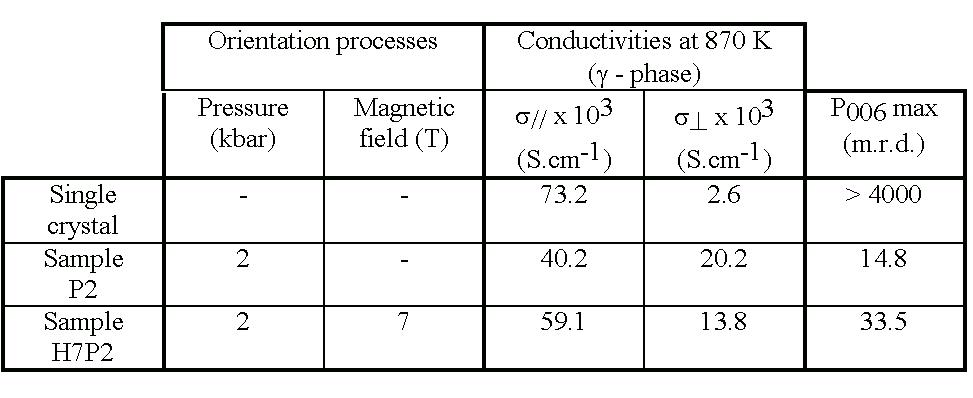 Table 1 : Summary of the orientation pole densities P006 and anisotropic conductivity of single crystal (SC), a 2 kbar uniaxially pressed powder (P2) and a sample oriented by combining axial pressure and a 7T magnetic field (H7P2). Taking into account the platelet shape of the single crystals, the conductivity measurements were performed parallel (s//) and perpendicular (s^) to the (a,b) plane. The conductivity s// and s^ measured on a single crystal can be considered as the upper and lower limits which can be attained on a perfect three-dimensionally oriented material. In contrast, on free powders, the absence of preferred orientation averages out the parallel and perpendicular conduction effects. Oriented powders have an intermediate conductivity behaviour. The sample characteristics and the values of the maximum {006} orientation densities are summarised in the table 1. The conductivity values s// and s^ are given at 870 K: the values obtained on the sample H7P2 are close to the values measured on the single crystal. The difference between s// and s^ is around 70.10-3 S.cm-1 for the single crystal, 50.10-3 S.cm-1 for the sample H7P2, and around 20.10-3 S.cm-1 for the sample P2. This difference is greater for the sample H7P2 than for the sample P2, and shows the effect of the magnetic field on the macroscopic conductivity anisotropy, in relation to the degree of texture. 2.2. Anisotropic magnetic properties in textured SmCO5 bulks [Legrand et al., 1997]Solidification in a magnetic field (Bt) of the intermetallic compounds SmCo5 and Sm2Co17 produces oriented polycrystals. The resulting high degree of orientation validates a model which explains the physical orientation mechanism which occurs during the solidification process. Due to the association of a rare earth and a transition metal, the ferromagnetic phases SmCo5 (1:5) and Sm2Co17 (2:17) are exhibiting high saturation magnetisation (Js1:5 = 0.95 T and Js2:17 = 1.4 T at room temperature), high Curie temperature (Tc1:5 = 710°C and Tc2:17 = 917°C), with a large uniaxial magnetocrystalline anisotropy along the crystallographic c axis. The crystal structure of the SmCo5 phase is hexagonal (CaCu5-type). The structure of the Sm2Co17 phase can be generated from that of SmCo5 by an ordered substitution of Co dumb-bells into some of the Sm sites. Consequently, these two phases are crystallographically coherent and particularly both have their c-axis as the easiest-magnetisation direction [Kumar, 1988]. Sm-Co type permanent magnets are based on these two ferromagnetic phases. The produced samples are magnetically characterised by magnetisation measurements carried out in a fluxmeter. Two experiments have been done (Samples 1 and 2). In each case, the material was heated up to the fusion by HF induction in an alumina crucible, then solidified within a few minutes in a vertical thermal gradient. Sample 1 was solidified without magnetic field, while a magnetic field Bt = 2.5 T was applied for Sample 2. The SEM analyses show that the samples consist of two phases SmCo5 and Sm2Co17 (Figure 1).
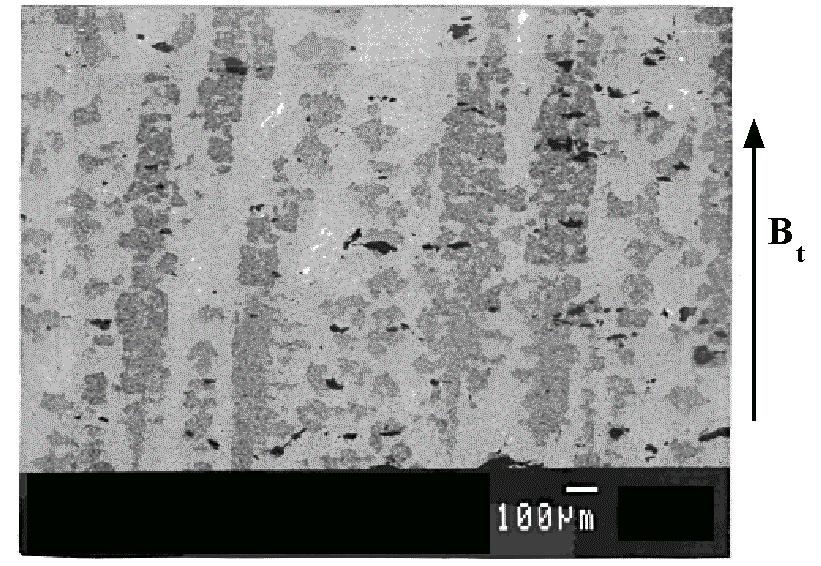 Figure 1: SEM micrography of Sample 2: a morphological texture parallel to Bt is formed by the Sm2Co17 phase (dark grey) in the SmCo5 matrix (light grey). The black areas correspond to holes and cracks in the materials. The 2:17 phase is aligned parallel to the vertical direction in the 1:5 matrix. This morphological texture has not been observed on Sample 1 and is attributed to the combination of the vertical thermal gradient and the applied magnetic field. The magnetisation measurements performed on the whole samples, in two perpendicular directions (vertical and radial) are presented on Figure 1. Sample 2 exhibits easy- magnetisation and hard-magnetisation directions parallel and perpendicular to Bt respectively. This is the volumic signature of a crystallographic orientation, the c-axes of the grains lying preferentially along the vertical direction. On the contrary, Sample 1 is rather isotropic and does not reveal the c-axes orientation. It is interesting to note that Sample 2 is both morphologically and crystallographically textured.
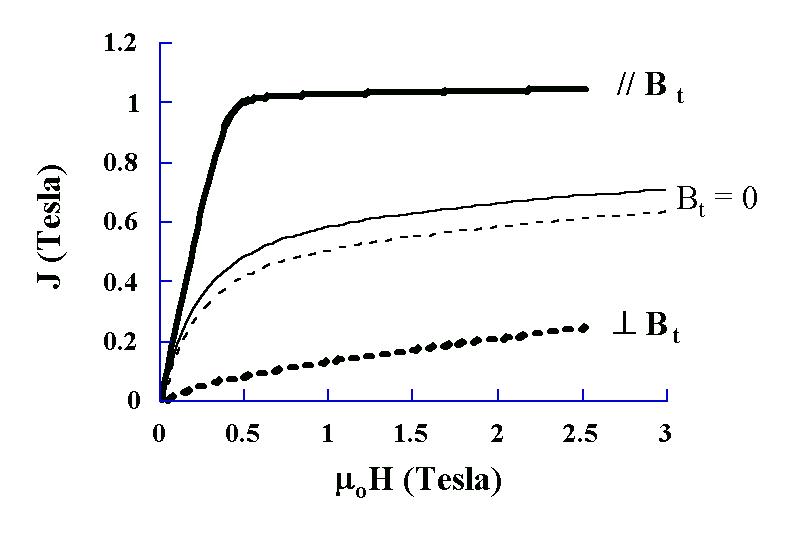 Figure 2: Magnetisation curves of the samples solidified in a vertical magnetic field Bt = 2.5T (Sample 2, bold lines) or in zero-field (Sample 1, fine lines). The full and the dotted curve correspond to vertical and radial measurements respectively. X ray diffraction pole figure measurements (Figure 3) reveal that c-axes deviate by no more than 10° from the Bt direction. This figure is in good correlation with the magnetisation curves (Figure 3 - insert).
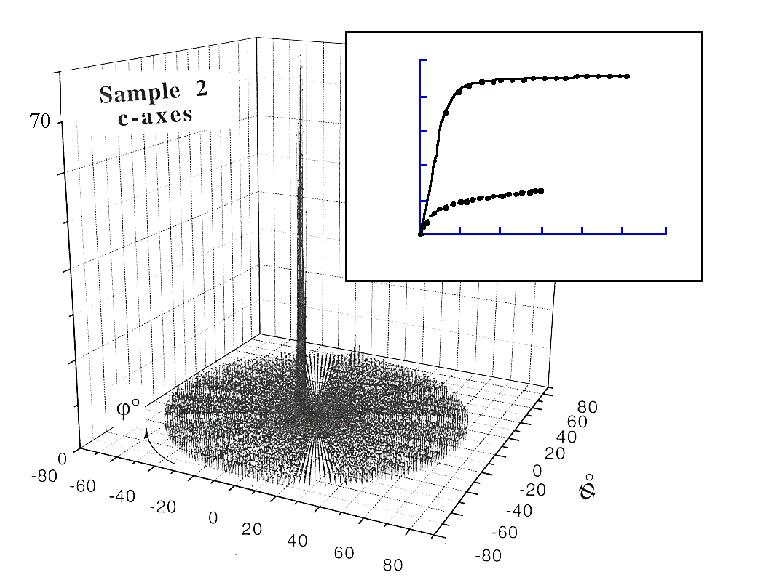 Figure 3: {002}-SmCo5 pole figure of sample 2 measured on a face perpendicular to Bt. Maximum density is 70 m.r.d.). Insert: corresponding magnetisation curves for radial and vertical directions. A direct application of the elaboration process used here is the production of high energy bulk Sm-Co permanent magnets. To a fundamental point of view, the experimental results of orientation in cold crucible are consistent with a simple model of anisotropy for crystallites which orient in the melt during the solidification process. Texture Influence on critical current density of superconducting Films, tapes and wires New high Tc superconductor ceramics crystallise in low symmetry space groups which give rise to strong anisotropy in their physical properties. One of them, the maximum current density (Jc) that the material can support is particularly important for potential applications. The superconductors of concern here are of orthorhombic symmetry and have Jc's approximately one order of magnitude larger in the (a,b) plane of the structure than along the perpendicular to it. It becomes then interesting to texture them in order to get the best current carrying capability.
YBCO films on (100)-MgO substrates [Pernet et al., 1994]:Many texture analyses of thin superconducting films have been documented in the past. However few quantitative analysis was operated up to now. This is mainly due to the strong preferred orientations developed in such films, which make most of the methodologies unusable. The quantitative texture of two series of YBCO films deposited on (100) MgO substrates by Pulsed Laser Deposition and Metal Organic Chemical Vapour Deposition was analysed using X-rays. The film thickness are in the range 1500Ĺ-2800Ĺ.All the films exhibit c-axis orientation perpendicular to the surface (c*), as revealed by the pole figure analysis. The {103} pole figures document a major epitaxial growth orientation with the a and b-crystal axes of the film aligned with the substrate axes (c*0). In addition, some minor in-plane orientations were found with aYBCO rotated by 45° around the normal to film plane from the c*0 orientation (c*45). The ratio c *45/c*0 orientations was measured by integrating the poles in the specific angular ranges. This ratio does not exceed 12% in the worst film. On the other hand, {102/012} pole figures revealed in some samples the presence of YBCO crystallites with a or/and b axes perpendicular to the film surface (a*). The ratio a*/c* orientations was calculated. The high intensity level of the poles allow to appreciate percentages as low as few tenth. The c*45 and a* orientations are both shown to drastically reduce the critical current density Jc (Figure 14), by one order of magnitude for approximately 1% of one or the other type of misorientation. The Jc variations versus c*45 and a* misorientations is non linear for both variables.
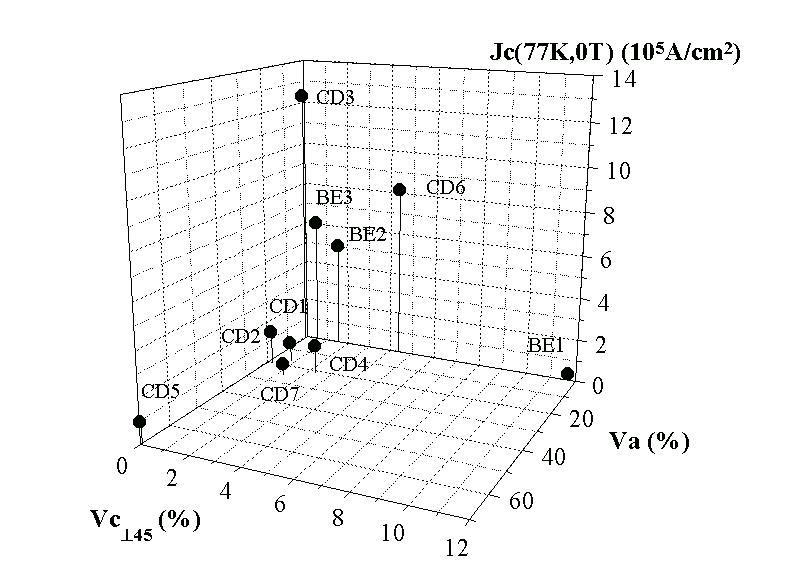 Figure 4: Decrease of the critical current density with misorientation defects observed in YBCO thin films deposited on (100) oriented MgO single crystals.
Ag-sheathed BSCCO tapes, multifilament and wires [Wenk et al., 1996]:Bismuth based high temperature superconductors are actually most amenable to the techniques currently available to manufacture long lengths of wire or tape with good performance, due particularly to their low weak link behaviour compared to the yttrium or thallium based compounds.Superconductor compounds are sheathed in silver, manufactured using the "oxide powder in tube" method (OPIT). They are shaped as tape or wire, then thermally treated to produce a practical superconductor that is more adapted for embedding in silver sheaths and consecutive cold or hot deformation and thermal treatment. Multifilamentary conductors are advantageous since the current is shared by multiple parallel conducting paths. From the literature, the highest critical current densities are obtained in general for multifilaments, monocore tapes, then wires. We used neutron diffraction experiments at ILL to analyse the texture of these samples. The tapes and wires were cut into segments ranging from 5mm to 10 mm long, and these segments were glued together to form a cube, keeping the segments strictly parallel. Since the elaboration processes are axi-symmetric, all the resulting textures can be characterised by profiles taken over angular ranges from normal to parallel to the tape surface, and normal to perpendicular to the wire direction. These profiles are then treated similarly to regular texture analysis, the OD is calculated, then inverse pole figures (which are a compact representation of axially symmetric textures) for main sample axes are calculated from it. All the tape samples showed strong textures with c-axis maxima up to 46 m.r.d. for the multifilament sample (MF 2212). This is visible in the inverse pole figures (Figure 5). For tapes (T 2212 and T 2223) these display a maximum at (001) with 37 m.r.d. and 26 m.r.d. respectively. For the wires (WW 2212 and WLA 2212), the wire direction inverse pole figures display a maximum region consisting of a girdle at high angles to (001) extending from (100) to (110), and the (001) densities are much lower than for the tapes because the c-axes form a girdle distribution, rather than a single maximum.
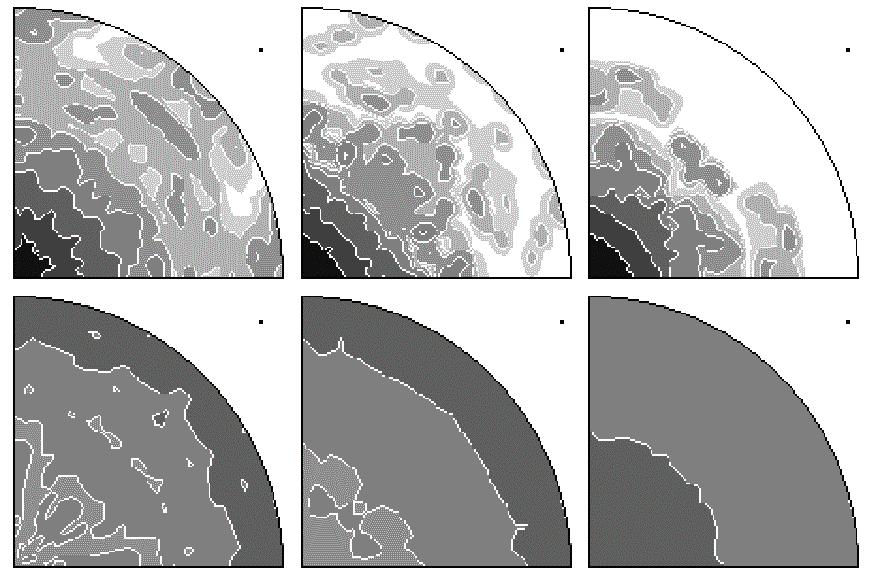 Figure 5: 001 inverse pole figures for the multifilament, tapes and wires samples. The maximum density is for the multifilament with 46 m.r.d. For comparison we have also measured the texture of P 2223, a sinter-forged hot-pressed bar of bulk Bi 2223 powder. The texture which was measured (3.4 m.r.d.) is much weaker in strength than the texture in tape T 2223, but similar in pattern with a 001 maximum in the compression direction. The strength of the texture is comparable to that of cold-pressed Bi 2223 powders. ConclusionWe have depicted some regular quantitative texture analysis using the Beartex package. Of course we neither have shown all the possibilities included in this package, which would concern for example more specific types of analysis (elastic constants for textured materials, sound wave velocities, ), nor we compared it to other existing program systems. We preferred to focus on general features that one would have to examine quantitatively the texture of materials. This allowed us to show how, using routine experiments and calculations, one can correlate the textural part of the microstructure to physical properties achieved in advanced materials.References
Please feel free to email any queries to:
r.j.cernik@dl.ac.uk
|