![[IUCr Home Page]](iucrhom2.gif)
![[Commission Home Page]](cpd.gif)
|
|
The IUCr-CPD Homepage is at http://www.iucr.org/iucr-top/comm/cpd/
Dealing with Absorption and Microabsorption in Quantitative Phase AnalysisGordon Cressey & Meryl BatchelderDepartment of Mineralogy, Natural History Museum, Cromwell Road, London SW7 5BD, UK. E-mail: G.Cressey@nhm.ac.uk; merb@nhm.ac.uk WWW: http://www.nhm.ac.uk/mineralogy/ Powder X-ray diffraction has been applied to quantitative phase analysis for over 70 years, and in this time many different methods have been developed to cope with the difficulties that mixed-phase analysis presents [1,2]. Traditionally, reference intensity ratio (RIR) methods [3,4], using either internal or external standards have been the most widely used, and now, with the availability of digital data, full pattern fitting techniques (including Rietveld methods) are becoming more popular [5,6,7]. However, all these methods can be time-consuming, and phenomena such as preferred orientation [8], absorption and microabsorption [9,10 ](arising from surface roughness) still present serious difficulties for quantitative analysis . A new and rapid phase quantification method [11,12] utilizing a position-sensitive detector (PSD) overcomes these particular problems in a unique way. For all quantification tasks the PSD method works simply by fitting the mixed assemblage pattern with proportionally- reduced 100% phase patterns of components identified in the mixture, and requires no spiking with an internal standard. Furthermore, pattern acquisition times of only 5 minutes are sufficient for full-pattern quantification purposes. Each sample is prepared as a flat-packed mount (spinning in its own plane) with the surface at a fixed angle to the beam and the 120� arc detector is stationary. Near- random intensity patterns are obtained over a very large angular range using this geometry, even for materials prone to preferred orientation in the mount. Linear absorption corrections can be applied quickly in a straightforward manner from first principles [12], provided that the phases in the mixture are identified. In order to demonstrate the efficacy of this PSD quantification method, the following two examples of high- and low-absorber mixtures are shown: (i ) synthetic hematite-quartz mixture and (ii) natural hematite-bearing clay (Ruabon Marl). In both of these samples absorption and microabsorption effects are extreme when using copper radiation, but the deliberate use of copper radiation with the PSD is actually very useful in assessing the magnitude of the microabsorption effect: in preparing the hematite quantification standard pattern, the sample was simply ground until the highest background fluorescence was achieved (Figure 1). The mixture sample was similarly ground until the background fluorescence stopped rising (Figure 2). These results show that the microabsorption effect can be minimized with a minimum of grinding. For quantification purposes, this means that the particle size and surface smoothness of each sample is replicated, and the microabsorption effect in the mixture is directly proportional to the microabsorption of the standard phase(s). Therefore, the microabsorption effect cancels out when proportioning the standard pattern to fit the mixed assemblage pattern. Results of phase quantification using this approach [12] are demonstrated for the hematite-quartz mixture (Figure 3) and the natural Ruabon Marl (Figure 4).
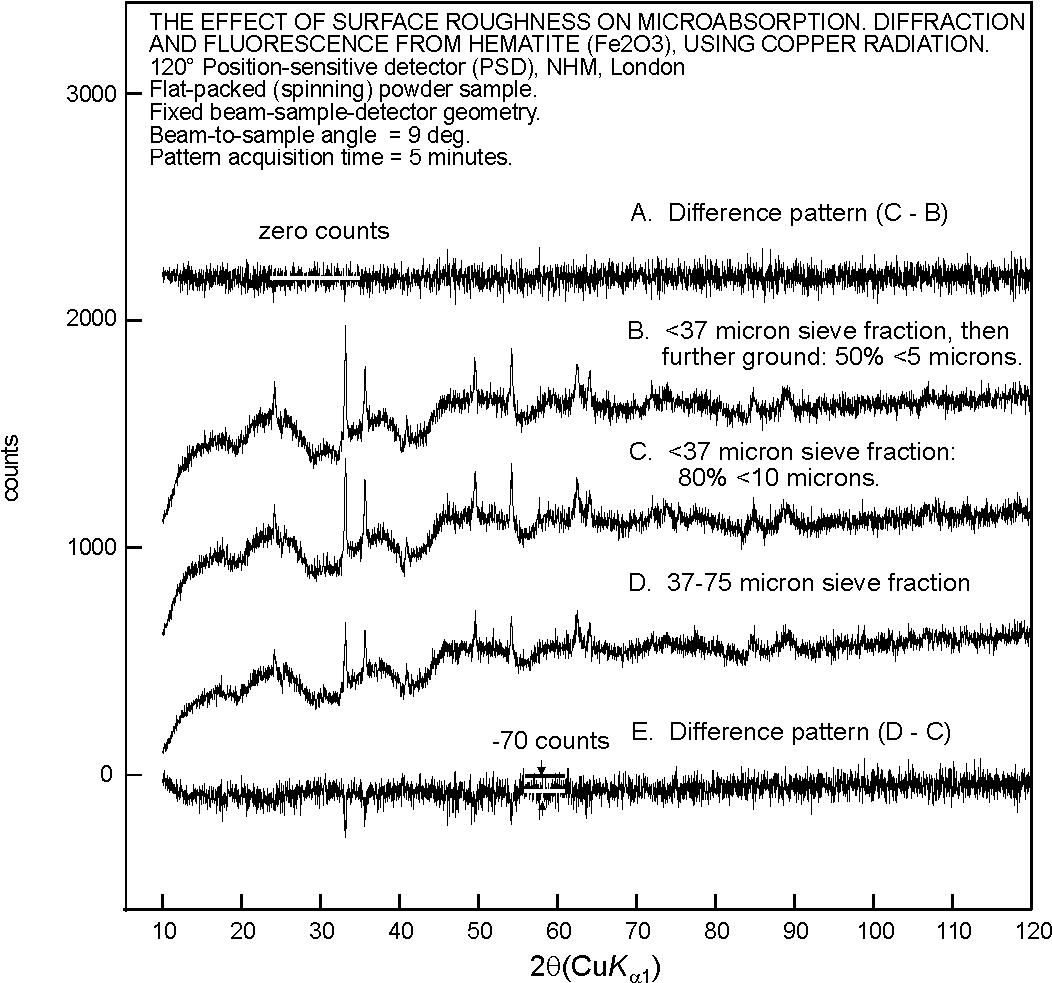 Figure 1. For coarse powder (D), whole pattern intensity is lost because of microabsorption: the intensity of both the Bragg peaks and fluorescence background (the undulating signal detected by the PSD) are lowered. Grinding to a powder of about 10 micron grain size minimizes the microabsorption effect, but further grinding to 5 microns has little further effect.
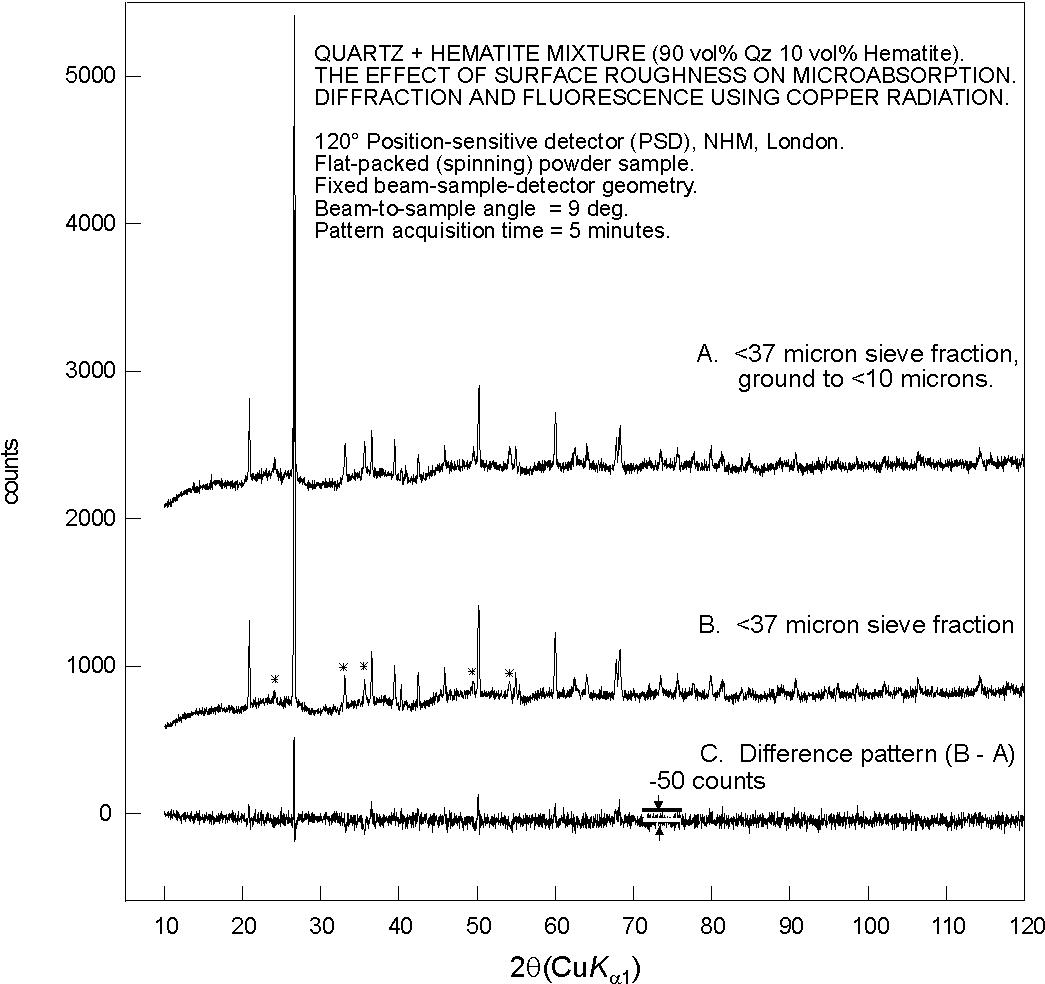 Figure 2. If the constituent grains are large, then the Bragg peaks and fluorescence background from the high-absorber phase (hematite peaks starred) appear too low and will lead to an error in quantification. Grinding to <10 microns ensures that microabsorption is minimized (top pattern).
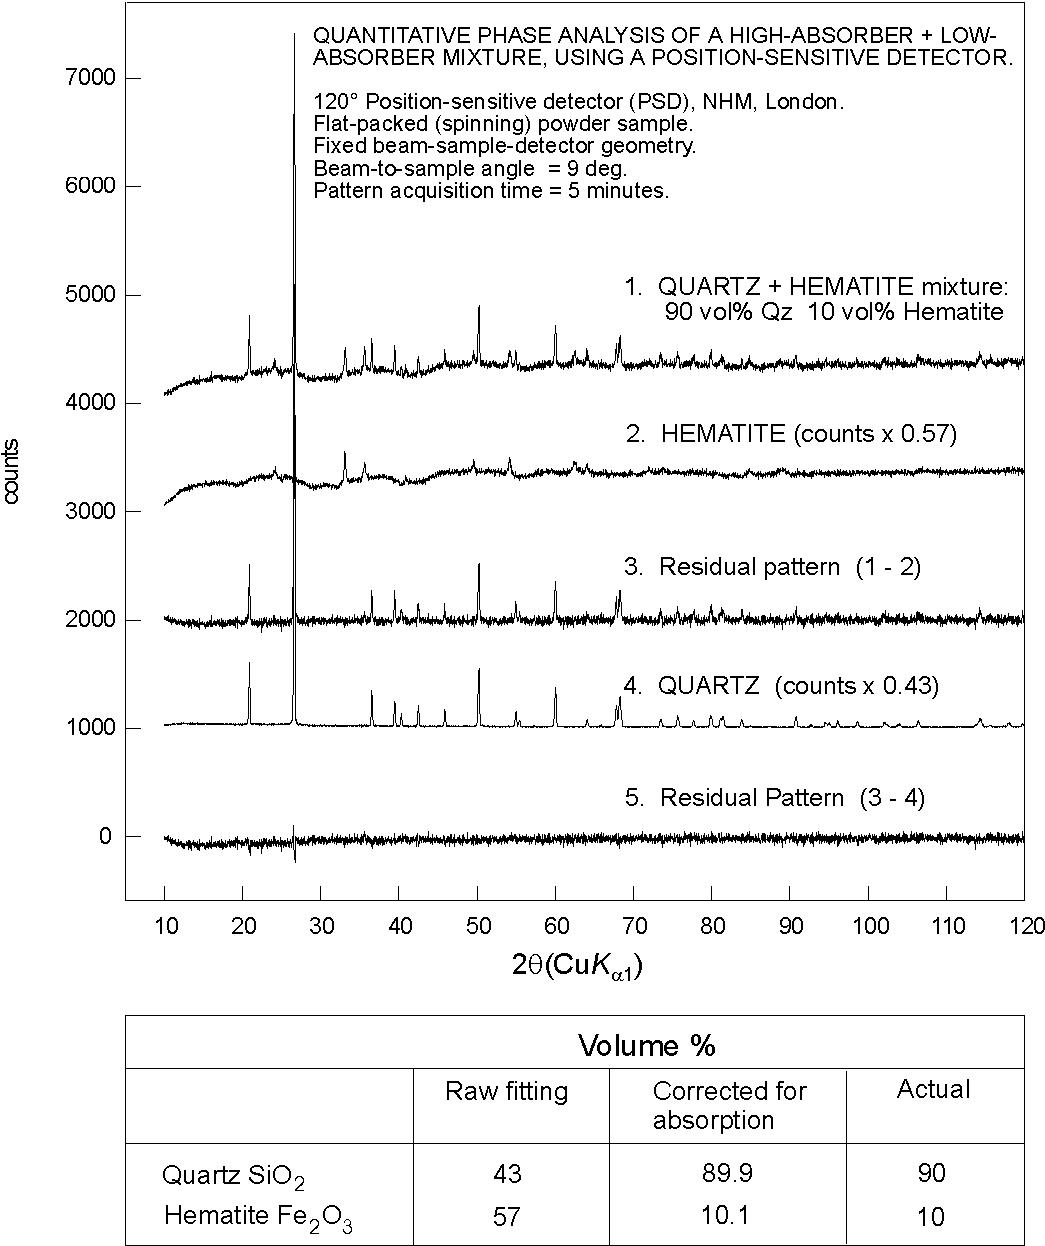 Figure 3. Quantification of a mixture of Quartz + 10% Hematite (by volume). Microabsorption was first minimized by grinding each sample to <10 microns. The correction for absorption (from linear absorption coefficients and densities) is based solely on the fit (apparent volume) measurements and assumes no knowledge of actual volumes [12].
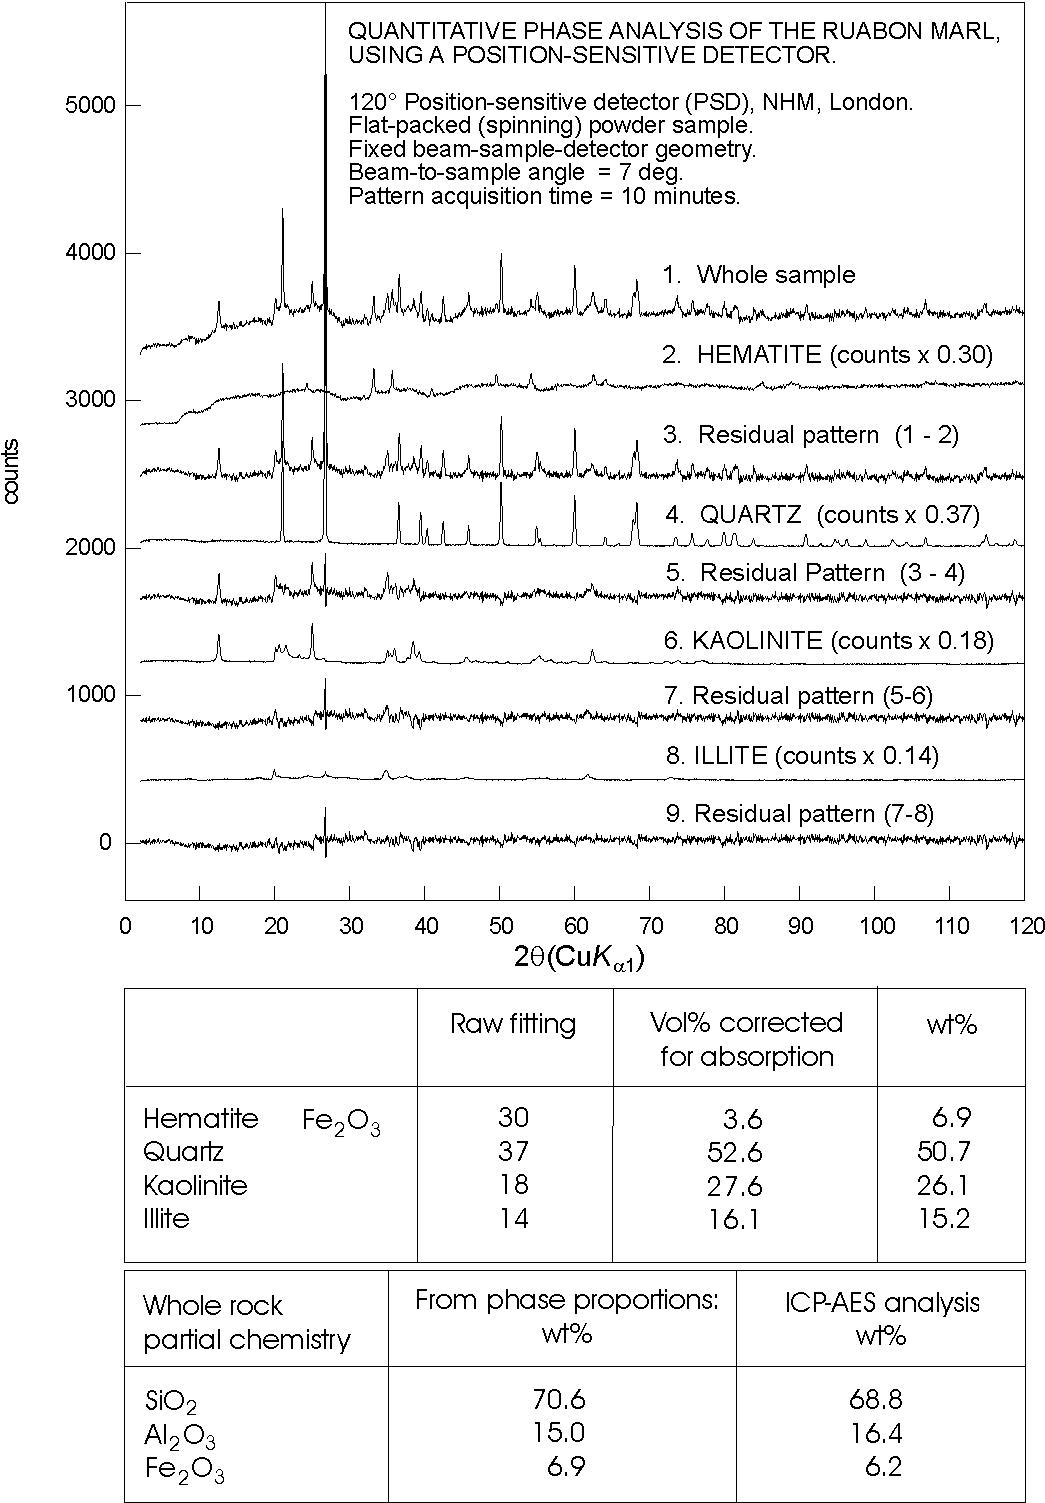 Figure 4. Phase Quantification of the Ruabon Marl, a natural hematite-bearing clay. Microabsorption from the hematite standard was minimized as outlined in Figure 1, and corrections for absorption applied as in [12]. References
Please feel free to email any queries to:
r.j.cernik@dl.ac.uk
|
